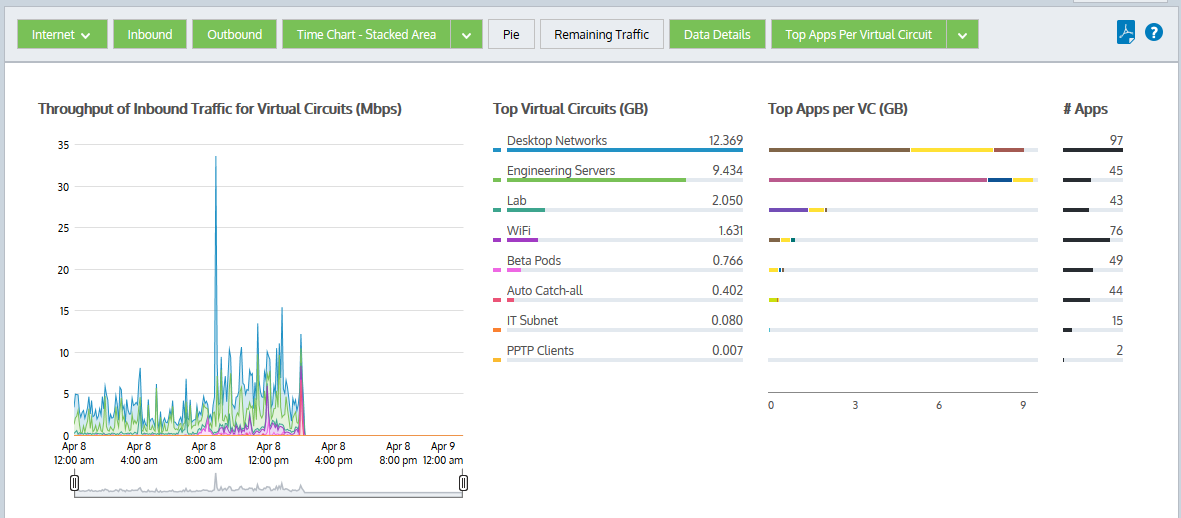
The virtual circuits report shows the top virtual circuits by volume and their average throughput. Virtual circuit traffic inbound into your LAN is reported separately from the outbound traffic. You can choose show the entire circuit traffic by adding in a category to represent the remaining virtual circuit traffic on your network; the cumulative stack on the throughput chart represents all the virtual circuit traffic through the appliance. This will help you understand the significance of the top virtual circuits relative to the whole. In addition to showing the data as a stacked cumulative display, you can choose to display the data as a line chart with a common zero baseline. You can optionally show the top three applications for each of the top virtual circuits. These charts can answer questions such as:
You can also drill into the applications for a specific virtual circuit by clicking on the virtual circuit name in the charts or the tables below the charts. The applications graph will be shown filtered for the specified virtual circuit.
|
|
Note The average bandwidth is calculated as the total bits observed in the charting interval and dividing by the number of seconds in that interval. For example, for a chart with an hour of data, the intervals are five minutes. |
|---|
Go to Monitor > Virtual Circuits.
Various components on the screen can be toggled on and off by clicking buttons above the charts. Note that when generating a pdf report of this screen, the toggle states are taken into account. That is, if you had toggled off the outbound charts, they will not be present in the pdf.
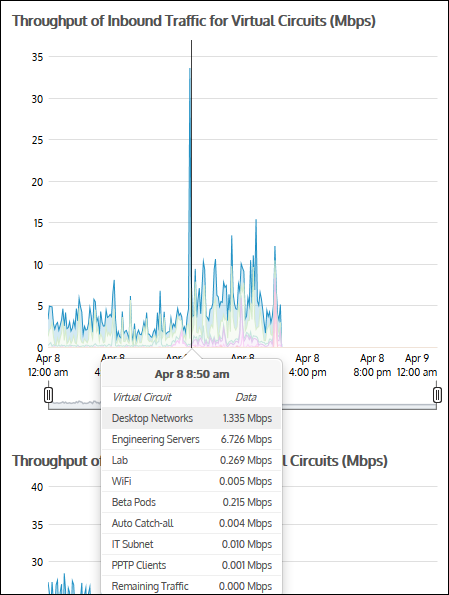
View the throughput charts as a line chart with the remaining traffic category toggled off so that each virtual circuit has a common zero baseline. Compare the line for the virtual circuit relative to the bandwidth that was assigned to that virtual circuit.
Create a virtual circuit. See Virtual Circuits.
The number of virtual circuits shown are configurable. Note that this configuration applies to all charts on the appliance. See Monitoring Configuration.
In general, yes. However, there are some cases where the traffic direction is different for subnets versus virtual circuits and so the totals will not match. For more information, see How Traffic Direction is Determined and its Implications.
|
|
|