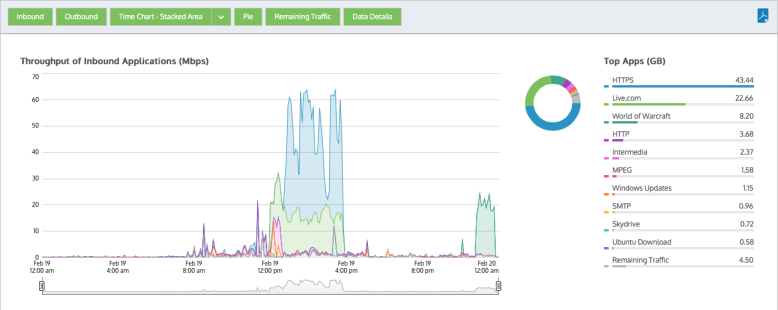
The applications report shows the top applications by volume and their average throughput. Any single application can also be graphed by clicking the filter icon for your desired application in the data table below. Application traffic inbound into your LAN is reported separately from the outbound traffic. You can choose to show the entire application traffic by adding in a category to represent the remaining application traffic on your network and so the cumulative stack on the throughput chart represents all the application traffic through the appliance. This will help you understand the significance of the top applications relative to the whole. In addition to showing a stacked cumulative view, you can choose to display the throughput as a line chart with a common zero baseline. You can also choose to show the application volumes as a pie chart.
These charts can answer questions such as:
Using this information you can determine if you need to create policies for these high data volume applications or for the high data volume applications that tend to have large spikes. You may want to create protection policies for your business critical apps and you may want to create limiting policies for high volume non-business critical applications such as recreational applications.
|
|
Note The average bandwidth is calculated as the total bits observed in the charting interval and dividing by the number of seconds in that interval. E.g. For a chart with an hour of data, the intervals are five minutes. |
|---|
If you drilled into the applications chart from any of the virtual circuit, subnets, or hosts charts, then the relevant virtual circuit, subnet, or host will be shown on the filter bar below the button bar. To turn off the filtering, click on the close 'x' in the filter tag.
Various components on the screen can be toggled on and off by clicking buttons above the charts. Note that when generating a pdf report of this screen, the toggle states are taken into account. That is, if you had toggled off the outbound charts, they will not be present in the pdf.
Toggle the Remaining Traffic button on the button bar. When toggled on, a grey chart series will appear in all charts (throughput, pie, top applications) representing all the applications on your network that are not explicitly represented in the top applications. If the remaining applications show vastly more data volume than the top applications, then the top applications may look insignificant relative to the total, and so you may need to toggle off the remaining traffic category to see the relative differences and usage patterns of the top applications.
Press the down arrow next to the stacked chart icon to switch to the line chart. Conversely, press the down arrow next to the line chart icon to switch to the stacked area chart. The line chart shows the applications against the common zero baseline so that the applications can be compared with one another and the pattern of a specific application is clearer. You can look for particular patterns such as spikes or flat tops.
View the throughput charts with the remaining traffic category toggled on. For any periods where the cumulative throughput is especially high (compared to the pipe size that this appliance is managing) is there an application or two that is consuming a significant portion of the bandwidth. If so, that application may be choking out other application and would be a candidate for control. Please note that you many need to go to the virtual circuit chart and filter the applications by the individual virtual circuits to understand whether an application is choking out others since the virtual circuits share bandwidth and an application my overrun one virtual circuit but not others.
View the throughput charts as a line chart with the remaining traffic category toggled off. If any of the lines representing the applications have raised flat tops, this may represent that the application is being limited by a policy or the capacity of your pipe.
|
|
Version Info: Filtering to show any single application is available in 7.0.1 and above. |
|---|
In the data table, each application has a filter icon on the right-hand-side of the row. By clicking on the filter icon, as shown below for Google Encrypted, only the selected application will be charted.
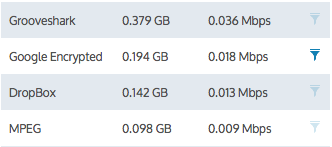
Figure - Click filter icon beside desired application to chart that application.
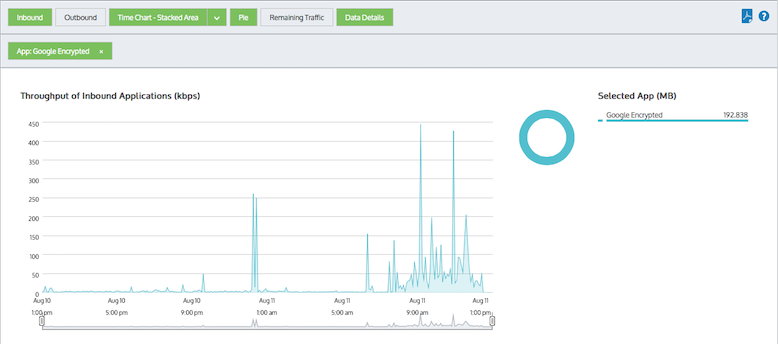
Figure - Applications are filtered to only show 'Google Encrypted'
While in filter mode, any other application filter icon can be clicked to change which application is charted.
To remove this filter and return to the top application set, click the 'x' on the green 'App: Google Encrypted' filter tag.
The number of applications shown are configurable by using the Chart Items setting on the Configuration > System > Setup > Monitoring page. Please note that this configuration applies to all charts on the appliance. See Monitoring Configuration.
|
|
|