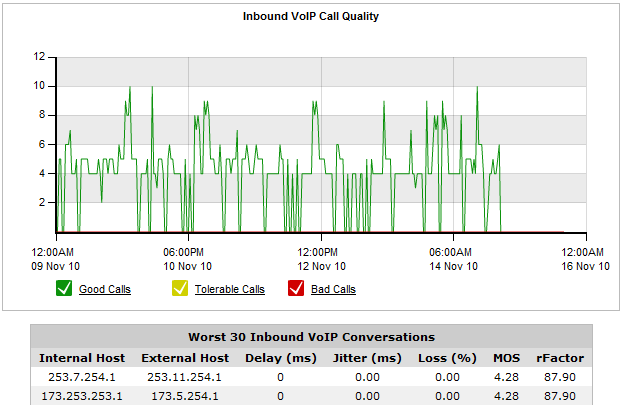
The VoIP Report shows call quality over time for the specified time period. The VoIP Report automatically includes any RTP-based VoIP calling such as SIP, H.323 and Cisco Skinny. This report can answer questions such as, “Are the VoIP conversations on my network of good enough quality?"
The graph shows 3 series, the number of "Good", "Tolerable" and "Bad" calls over time. The table below the following chart lists the worst quality inbound and outbound VoIP calls for the specified time period.
The report for VoIP traffic can be created by visiting the Solution Center (Solution Center > Show Solution Center). See Solution Center for information about creating the VoIP report. The created VoIP report can be found at Solution Center > VoIP Performance.
MOS (mean opinion score) is a measure of the call quality. Historically, users would listen to calls and would report whether their experience was good or bad on a 5 point scale. Modern systems, such as the Exinda appliance, automate MOS testing taking into account network dependency conditions. The scores have the following meaning.
rFactor is a measure of the call quality in IP networks taking into account network delay and impairments. rFactor ranges from 0 (extremely poor quality) to 100 (high quality). Any rFactor less than 50 is not acceptable.
|
|
|