The users report shows the top users by data volume for the selected time period. Traffic inbound into your LAN is reported separately from the outbound traffic.You can choose to view either the internal users or the external users on the users report. These charts can answer questions such as
Using this information you can determine if you need to create policies for these high data volume users. You may want to create protection policies for your important users, like your CEO or finance department, or create control policies to limit users who are abusing the network.
Users are associated with an IP address. During a flow, traffic flows from one host to another. Typically, one host is considered internal to your network; the other is external. Hosts that fall into a network object that was defined as internal are considered internal to your network; Hosts that fall into a network object that was defined as external are considered external to your network. Keep in mind that the traffic is inbound and outbound relative to your LAN – not relative to the host or user. Therefore, inbound traffic for an external user means that user was sending data inbound into your network.
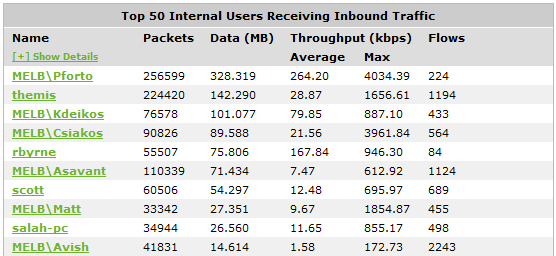
You can drill into the user by clicking on the user name in the tables below the charts. This will show the Applications Report for the user that you drilled into. You can then use the selector on the Applications Report page to show URLs or conversations or hosts that involved the user.
The tables at the bottom of the report shows for each of the top users, the total amount of data, and the maximum and average throughput rates, the number of packets, and the number of flows for the selected time period. More network metrics, such as, round-trip time (RTT), network and server delays, and TCP efficiency can be shown by clicking on the Show Details link in the tables.
Go to Monitor > Users.
Use the Select Users to View selector at the top of the page.
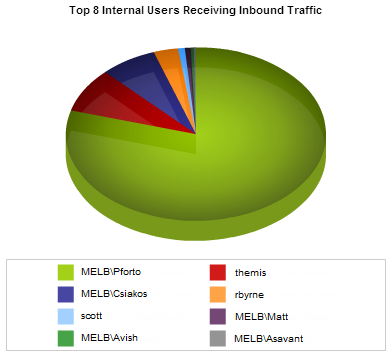
You can hover over the pie slices to view the amount of data transferred as well as view the percentage of the pie. Note that the pie is showing only the top items, so the proportion is relative to the top items - not relative to all the traffic through the appliance. That is, if one wedge showed 50% of the traffic, that means it is 50% of the top items, not 50% through the appliance.
|
|
|