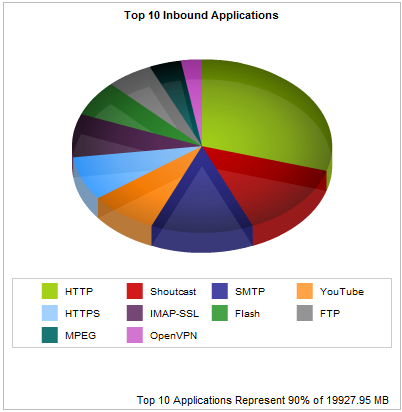
The Application Drill-in Report shows the top applications by data volume for the selected time period. The applications report shows inbound traffic separately from outbound application traffic. These charts can answer questions such as, “Which applications are part of the application group that I clicked on? Which applications did a particular user or host use?”
You can drill into the application by clicking on the application name in the tables below the charts. This will show the Hosts Report that use that particular application.
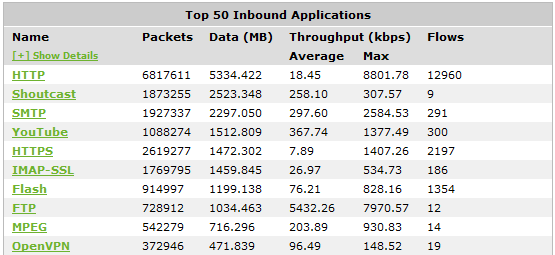
The tables at the bottom of the report shows for each of the top application groups, the total amount of data, and the maximum and average throughput rates, the number of packets, and the number of flows for the selected time period. More network metrics, such as, round-trip time (RTT), network and server delays, and TCP efficiency can be shown by clicking on the Show Details link in the tables.
This report can only be found by drilling in from other reports, such as application group, hosts, users, conversations, subnets.
You can hover over the pie slices to view the amount of data transferred as well as view the percentage of the pie. Note that the pie is showing only the top items, so the proportion is relative to the top items - not relative to all the traffic through the appliance. That is, if one wedge showed 50% of the traffic, that means it is 50% of the top items, not 50% through the appliance.
|
|
|