Version Info: The hosts report as a time-series is available in version 7.0.3 and higher.
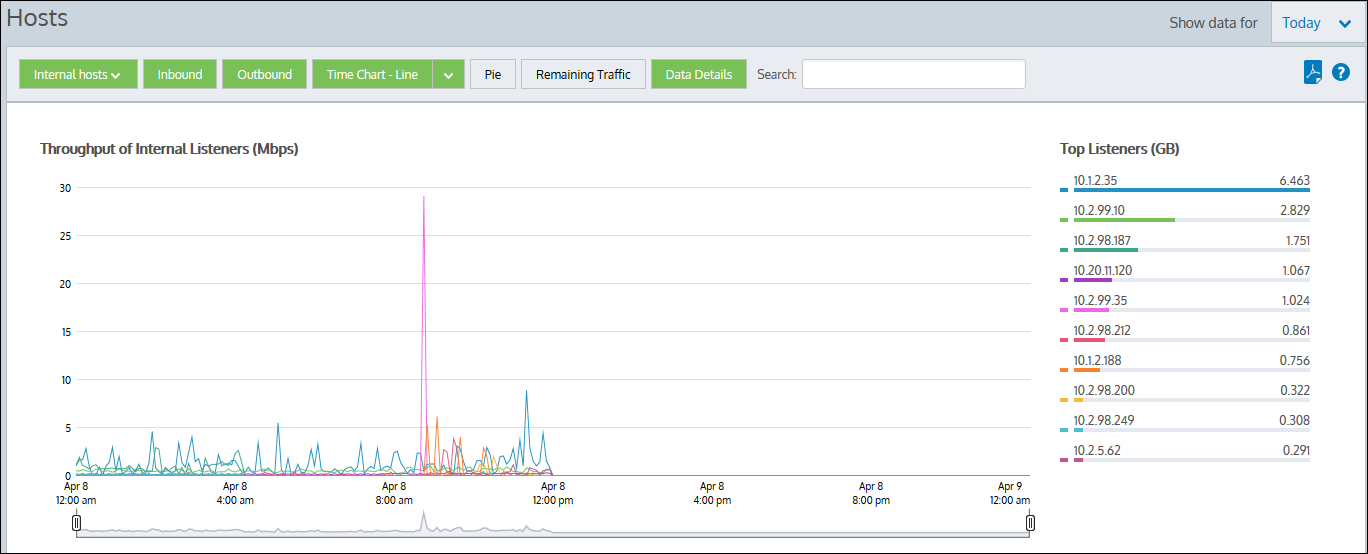
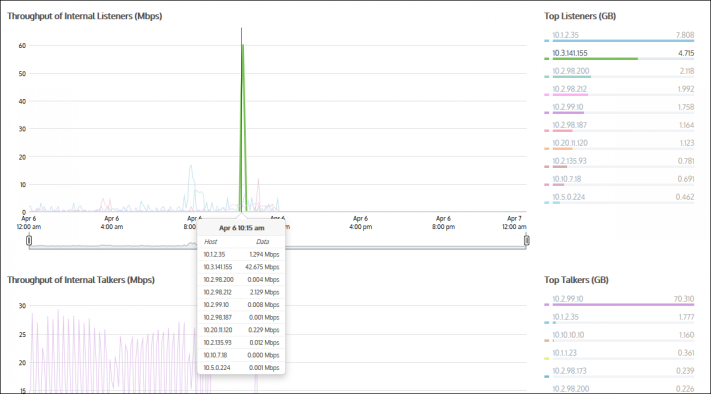
The Hosts report shows the top hosts by data volume for the selected time period. Traffic inbound into your LAN is reported separately from the outbound traffic.You can choose to view either the internal hosts or the external hosts on the hosts report, and data is graphed separately for Top Listeners and Top Talkers. This allows an enterprise with multiple sites to monitor all their corporate systems while excluding monitoring of all the servers on the Internet.These graphs can answer questions such as:
Use this information to determine if you need to create policies for these high data volume hosts. You may want to create protection policies for your business critical server machines or create control policies to limit hosts that are abusing the network.
|
|
Version Info: The hosts report as a time-series is available in version 7.0.3 and higher. |
|---|
|
|
Note The average bandwidth is calculated as the total bits observed in the charting interval and dividing by the number of seconds in that interval. E.g. For a chart with an hour of data, the intervals are five minutes. |
|---|
Hosts are IP Address endpoint's in IP transactions and are usually client PCs or servers. During a flow, traffic flows from one host to another. Typically, one host is considered internal to your network; the other is external:
Keep in mind that the traffic is inbound and outbound relative to your LAN – not relative to the host. Therefore, inbound traffic for an external host means that host was sending data inbound into your network.
Go to Monitor > Hosts.
Various components on the screen can be toggled on and off by clicking buttons above the charts. Note that when generating a pdf report of this screen, the toggle states are taken into account. That is, if you had toggled off the outbound charts, they will not be present in the pdf.
Note: If there are more than 100,000 hosts to display, it may take several minutes to render the screen when Remaining Traffic is enabled. |
You can drill into the host by clicking on a host in the Top Listeners or Top Talkers list (located to the right of the graphs). Click a particular host to view the Applications Report for the host that you selected. You can then use the selector on the Applications Report page to show URLs or conversations that involved the host.
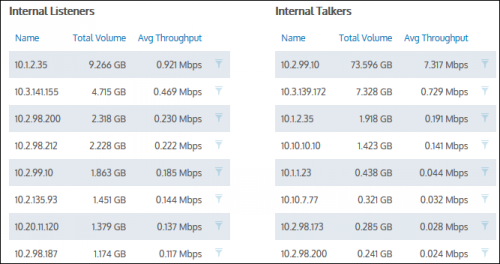
The tables at the bottom of the Hosts report information for the top listeners and talkers and include the IP Address, the Total Volume of data, and the Average Throughput rates. Click on any entry in the table to open the Applications Report for that specific host.
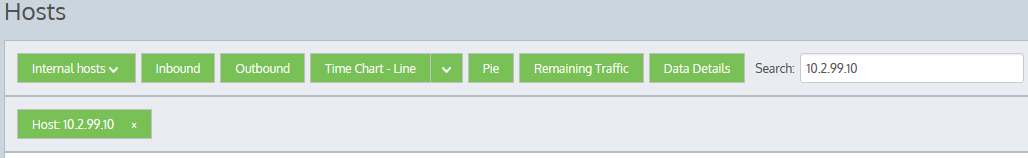
If the host you are looking for is not listed in the Top hosts, you can use the search function to locate data for a single host only. Type a single IP Address in the Search field to locate data for a particular host. If entering an IPv6 host, use the full IPv6 address only. When the data is retrieved, the individual host is shown on the filter bar below the button bar. To turn off the filtering, click on the close 'x' in the filter tag.
|
|
|