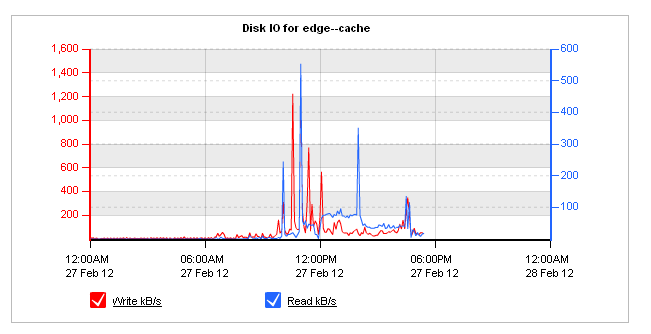
The Disk IO Report shows read and write disk usage for each service in kB/s over time for the selected time period. This chart can answer questions such as, “Has my disk I/O usage suddenly increased or over time? If so, which subsystem is responsible for the increased disk I/O usage? If WAN memory acceleration, or CIFS acceleration, or edge cache performance is suffering, was there a decrease in its I/O load? Was that decreased I/O load due to another subsystem's increased I/O load? I swapped an appliance and loaded the same configuration and it seems slower. If all the I/O rates look lower, then maybe this is a disk issue."
The disk usage for each of the following services can be shown by selecting the desired service from the Service selector.
Go to Monitor > System > Disk IO.
|
|
|