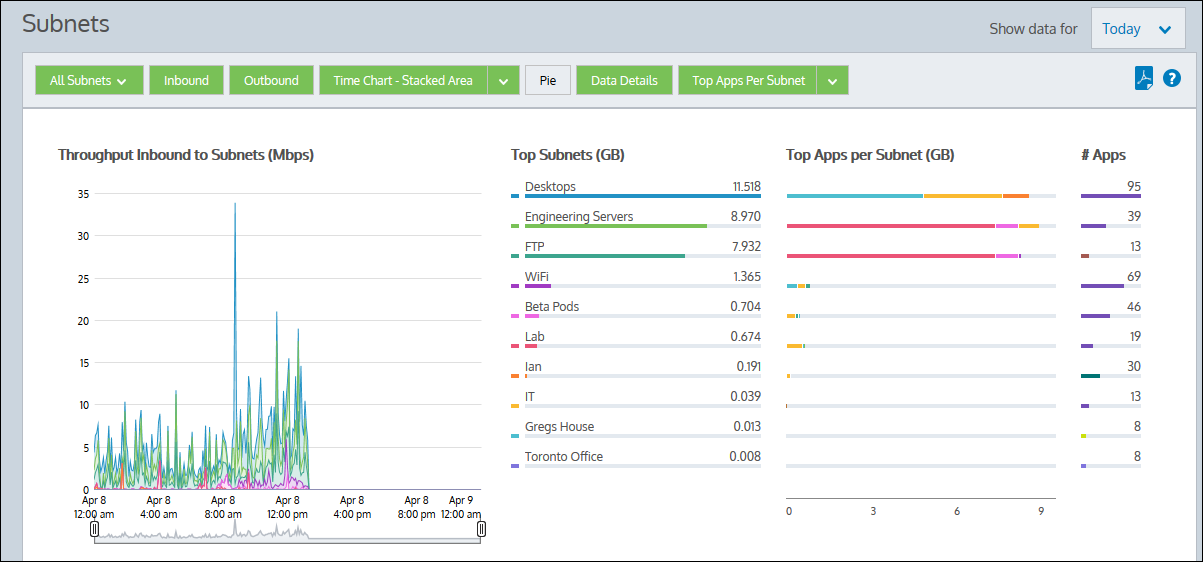
A network object, referred to as a subnet for monitoring purposes, can include multiple network subnets and/or multiple IP addresses. The subnets report shows the top subnets by volume and their average throughput for the selected time period. When subnets are defined, they can be specified as being either internal to your network or external. The inbound and outbound traffic for these subnets are reported separately. Inbound and outbound traffic is relative to the subnet, not relative to the Exinda. Subnets are not required to be mutually exclusive, and so traffic may be reported in more than one subnet. You can optionally show the top three applications for each of the top subnets.
These charts can answer questions such as:
You can toggle on or off particular chart components. Note that when generating a pdf report of this screen, the toggle states are taken into account.
|
|
Note The average bandwidth is calculated as the total bits observed in the charting interval divided by the number of seconds in that interval. E.g. For a chart with an hour of data, the intervals are five minutes. |
|---|
Go to Monitor > Subnets.
Create a network object. See Configure Network Objects .
If Network Object/Subnet statistics collection is disabled, the Subnets report will not include application data for the time period the collection was disabled. See Configure Network Objects.
If the Subnet Report checkbox is not enabled on the definition of the subnet, then the data will not be included in the report. If the data was collected, then enabling the Subnet Report will immediately show the data in the chart.
Press the down arrow next to the Stacked Chart button to select Line Chart to switch to the line chart. Conversely, press the down arrow next to the Line Chart button to select Stacked Chart and switch to the stacked area chart. The line chart shows the subnets against the common zero baseline so that the throughput of the subnets can be compared with one another and the pattern of a specific subnet is clearer. You can look for particular patterns such as spikes or flat tops. If your subnets are not defined to be mutually exclusive, displaying the throughput in a line chart with a common zero baseline may make the most sense, as the cumulative values chart will double count some data and may not be meaningful. However, if you have defined your subnets to be mutually exclusive then stacked area charts is an option.
Toggle on the pie chart by clicking the Pie button. Note that if your subnets are not defined to be mutually exclusive, that is, data is captured in more than one subnet, then the pie chart does not hold much meaning.
The number of subnets shown are configurable. Note that this configuration applies to all charts on the appliance. See Monitoring Configuration.
In general, yes. However, there are some cases where the traffic direction is different for subnets versus virtual circuits and so the totals will not match. For more information, see How Traffic Direction is Determined and its Implications.
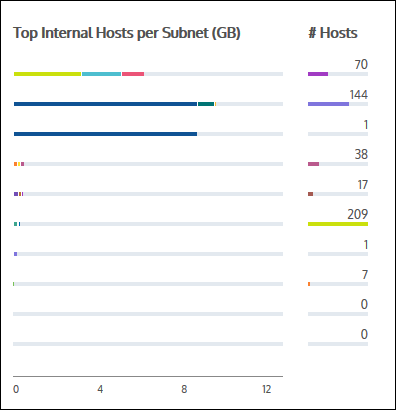
By default, this report displays the Top Apps per subnet, but you can change the view to Top Internal or Top External Hosts per Subnet. Click the drop-down arrow beside the Top Apps per Subnet button to view these other options. When the display updates, the Top hosts data is mapped to a bar graph. You can brush over any host to view it's IP Address and throughput data.
|
|
Version Info: Toggling the Top Internal Hosts per Subnet and Top External Hosts Per Subnet within this report is available in version 7.0.3 and higher. |
|---|
You can drill into the applications for a specific subnet by clicking on the subnet name in the Top Subnets chart or by clicking on the subnet name in the table below the charts. You can also drill into the hosts, or users, or conversations for a particular subnet by clicking on the View Users, View Conversations, View URLs links in the table. The applications, hosts, users, conversations, or URLs graph will be shown filtered for the specified subnet.
|
|
|