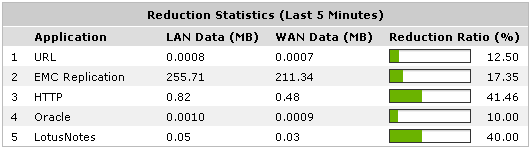
The Reductions in Real Time monitor shows reduction by application during the last 5 minutes. This report can answer questions such as, “Am I getting the reduction that I am expecting?"
The Reductions in Real Time monitor can filter to show inbound application traffic, outbound application traffic, or bi-directional traffic. The amount of data on the LAN-side of the appliance and on the WAN-side of the appliance is show as well as the reduction ratio during the previous 5 minute sliding window. You can set the chart to refresh frequently, infrequently, or not at all. Each refresh shows 5 minutes of data ending on the most recent 10 second boundary. That is, if it refreshes at 9:38:17, the chart will show data from 9:33:10 - 9:38:10.
Go to Monitor > Real Time > Reduction.
Reduction Ratio = (Data Transfer Size Before Exinda - Data Transfer Size After Exinda) / Data Transfer Size Before Exinda
Reduction Ratio = LAN Data - WAN Data / LAN Data
|
|
|