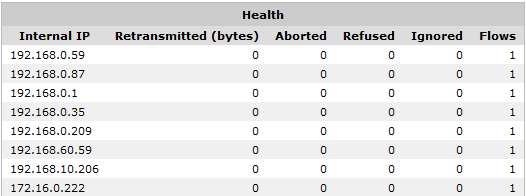
The Host Health in Real Time monitor shows the most unhealthy hosts as measured by the number of retransmitted bytes during the last 10 seconds. This report can answer questions such as, “Which internal hosts are having the most difficulty with successfully transmitting traffic?”
The Host Health in Real Time monitor shows internal hosts separately from external hosts. The Host Health in Real Time monitor shows health metrics, such as, amount of retransmitted bytes, number of aborted connections, number of refused connections, number of ignored connections, and the flow count for each internal and external host monitored by the Exinda appliance during the last 10 seconds. The traffic is sorted by the amount of retransmitted bytes. You can set the chart to refresh frequently or infrequently or not at all. Each refresh shows 10 seconds of data.
Go to Monitor > Real Time > Host Health.
|
Aborted Connections |
Connections that were unexpectedly aborted by either the client or server sending a TCP reset. |
|
Refused Connections |
Connections that were refused by the server (TCP SYN sent, received ICMP refused or TCP reset in response). |
|
Ignored Connections |
Connections that were ignored by the server (TCP SYN sent, received nothing in response). |
|
|
Note: These statistics are only available if the Performance Metrics ASAM Module is enabled on the System | Setup | Monitoring page. |
|---|
|
|
|