The Conversations in Real Time monitor shows the top conversations by throughput observed by the Exinda appliance during the last 10 seconds. This report can answer questions such as:
The Conversations in Real Time monitor shows inbound conversation traffic separately from outbound conversation traffic. The conversations are represented as external IP, internal IP, and application. Some traffic types will show extra information, such as the URL for example, in square brackets following the application. The traffic is sorted by transfer rate. The packet rate and number of flows for each conversation in that 10 second period is also shown. You can set the chart to refresh frequently or infrequently or not at all. Each refresh shows 10 seconds of data.
The Conversations in Real Time monitor can help you diagnose the following by:
Go to Monitor > Real Time > Conversations.
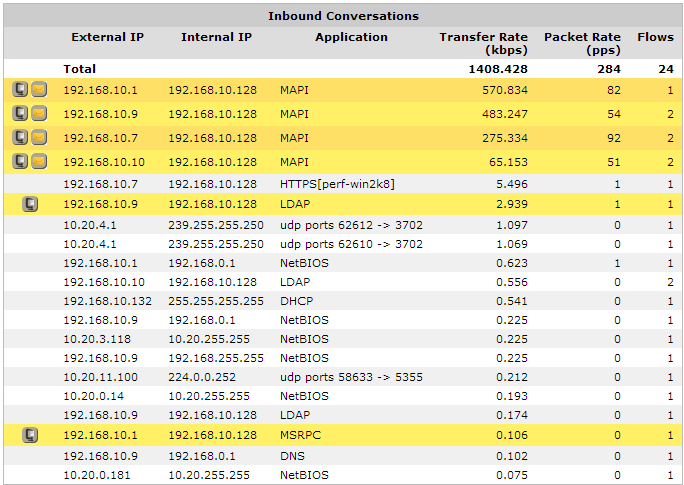
When a conversation has been accelerated by the Exinda appliance, the conversation is highlighted in yellow and the application acceleration technologies being applied to that conversation are displayed on the left-hand side as a series on icons.
For example, the FTP connection below is accelerated (shown in yellow) and is also been processed by WAN Memory (indicated by the icon).

When a conversation has been processed by Edge Cache, it is highlighted in blue.

The following legend describes the meaning of each acceleration icon.
|
|
WAN Memory: The connection is been processed by WAN Memory. |
|
|
CIFS Acceleration: The connection is been processed by CIFS Acceleration. |
|
|
SSL Acceleration: The connection is been processed by SSL Acceleration. |
|
|
NCP Acceleration: The connection is been processed by NCP Acceleration. |
|
|
MAPI Acceleration: The connection is been processed by MAPI Acceleration. |
When an appliance is deployed in a High Availability (HA) or Clustering mode, the following icons may also appear next to each conversation.
|
|
Asymmetric: The traffic is asymmetric, and is not being accelerated. |
|
|
Locally Bridged: The connection is passing through this appliance in the cluster. If the row is colored yellow, then the flow is remotely accelerated. |
|
|
Remotely Bridged: The connection is passing through another appliance in the cluster. If the row is colored yellow, then the flow is remotely accelerated. |
|
|
Locally/Remotely Bridged: The connection is passing though both this and other appliances in the cluster. (Asymmetric traffic) If the row is colored yellow, then the flow is remotely accelerated. |
|
|
Locally Bridged + Locally Accelerated: The connection is passing through this appliance in the cluster and is being accelerated on this appliance. |
|
|
Remotely Bridged + Locally Accelerated: The connection is passing through another appliance in the cluster and is being accelerated on this appliance. |
|
|
Locally/Remotely Bridged + Locally Accelerated: The connection is passing through both this and other appliances in the cluster and is being accelerated on this appliance. (Asymmetric traffic) |
When an appliance is deployed in a High Availability (HA) or Clustering mode, the following icons may also appear next to each conversation.
Simply type the IP address or subnet in the IP/Subnet Filter field at the top of the screen and click Apply. The conversations can be filtered by IPv4 or IPv6 addresses.
Check the Show Users checkbox.
|
|
Note: You must have Active Directory configured to display user names. See Integrate with Active Directory. |
|---|
Toggle on or off the Group checkbox at the top of the screen.
Select Show Policies checkbox at the top of the screen.
If you are unsure whether traffic is being processed properly by the virtual circuit or the policies within your virtual circuit, it is best to use real time monitoring to determine if traffic is hitting your virtual circuit as you would expect.
|
|
|