Note
Given that this report shows all data on the wire, the report may also include traffic that is not seen on the WAN, such as local LAN broadcasts, etc.
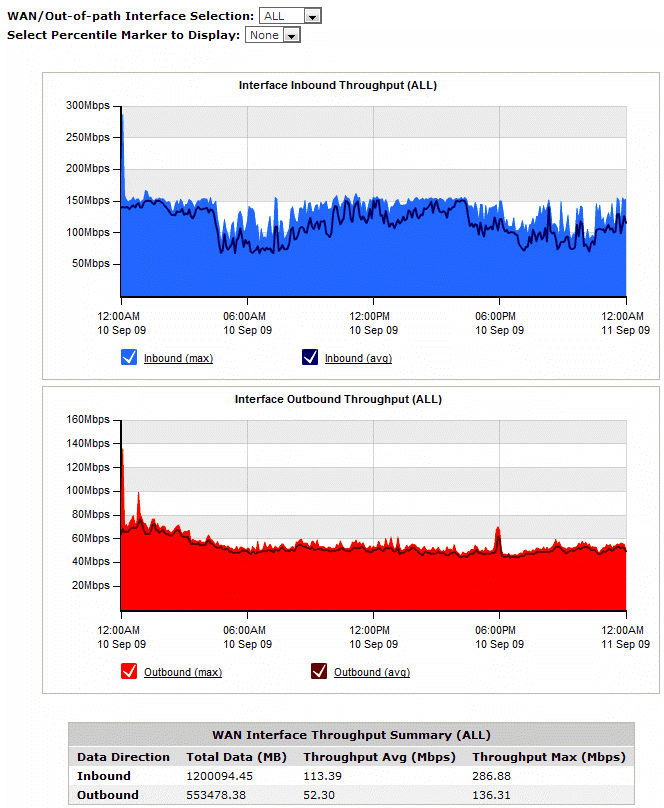
The Interfaces Throughput Report shows the throughput for a defined time period either for a particular interface or for all interfaces aggregated together. This report can answer questions such as:
The throughput for inbound traffic is shown separately from outbound traffic. The charts show maximum throughput and average throughput. The maximum throughput is determined by looking at 10 second samples of data. The average throughput is calculated by averaging the amount of data transferred over the time period specified by the granularity. For instance, when looking at a day of traffic, each data point represents 5 minutes of data. The average shows the average data transferred over each 5 minute period. You can better understand the throughput distribution by adding a percentile marker line. The line shows that the nth percentile of (maximum) throughput observations exceeds the specified throughput rate. For instance, if the 95th percentile is at 55 Mbps, then 5 out of 100 maximum throughput observations appeared above 55 Mbps.
The table at the bottom of the report shows the total amount of data transferred into and out of the WAN-side interface(s), and the maximum and average throughput rates for the selected time period.
|
|
Note Given that this report shows all data on the wire, the report may also include traffic that is not seen on the WAN, such as local LAN broadcasts, etc. |
|---|
Go to Monitor > Interfaces > Packets per Second.
Select the desired bridge (WAN interface), policy-based routing interfaces, or WCCP interface from the WAN/Out-of-path-Interface Selection selector.
Select the desired percentile level from the Select Percentile Marker to Display selector.
|
|
|