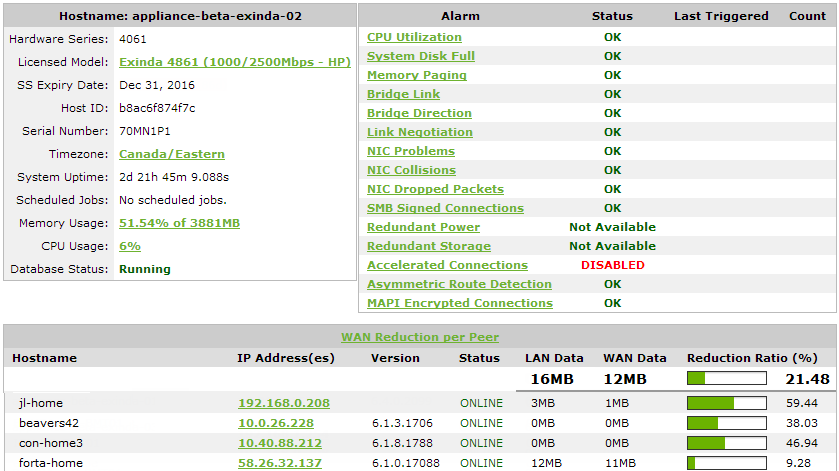
The System dashboard shows system information, the state of system alarms as well as a summary of other Exinda appliances and their respective reduction statistics. The dashboard can answer questions, such as "Are there any issues with the NICs, or CPU utilization, or SMB signed connections, etc? What is this appliance licensed for? What is this appliance's host ID? What is the reduction ratio between this appliance and others that it's accelerating with?"
The status of the appliance database is displayed as Database Status. The possible statuses include:
|
|
|