The Conversations in Real Time monitor shows the top conversations by throughput observed by the Exinda appliance during the last 10 seconds. This report can answer questions such as, “Is the traffic being processed by Edge Cache properly?"
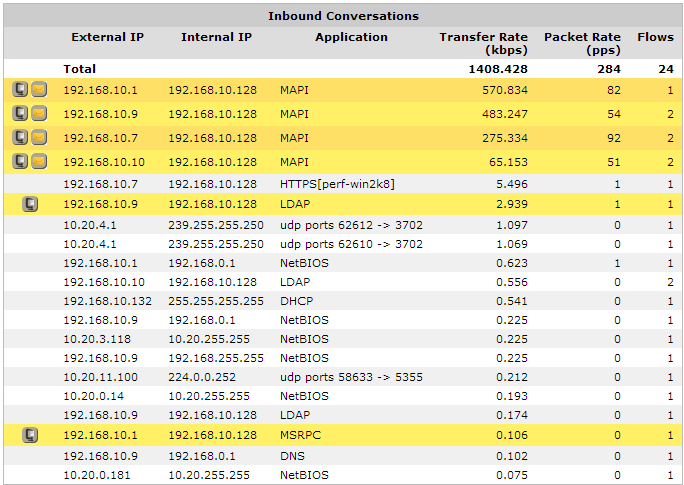
The Conversations in Real Time monitor shows inbound conversation traffic separately from outbound conversation traffic.The conversations are represented as external IP, internal IP, and application. For HTTP or HTTPS, the URL will appear in square brackets following the application. The traffic is sorted by transfer rate. The packet rate and number of flows for each conversation in that 10 second period is also shown. You can set the chart to refresh frequently or infrequently or not at all. Each refresh shows 10 seconds of data.
When a conversation has been processed by Edge Cache, it is highlighted in blue.

|
|
Note: All conversations that are evaluated by Edge Cache will be highlighted in blue even if the object is excluded from storage in Edge Cache due to Edge Cache settings. |
|---|
To learn more about this monitor, see Conversations in Real Time in the main user guide.
< Previous: Edge Cache Report | Next: Troubleshooting Edge Cache >
|
|
|