A network object, referred to as a subnet for monitoring purposes, can include multiple network subnets and/or multiple IP addresses.With the subnets report you can monitor traffic by these defined subnets, and see network usage for each of your branch offices, your business departments, a class of network devices such as printers, or any other network object that you define. The subnets report shows the top subnets by volume for the selected time period. When subnets are defined, they can be specified as being either internal to your network or external. The inbound and outbound traffic for these subnets are reported separately. Inbound and outbound traffic is relative to the subnet, not relative to the Exinda. Subnets are not required to be mutually exclusive, and so traffic may be reported in more than one subnet.You can choose to see the top hosts, users, conversations or URLs for a given subnet. These charts can answer questions such as, “What are the top subnets in my network? What are the top applications for a particular branch? Who are the top users or hosts for the New York branch?”
You can also drill into the subnets to see the applications, hosts, conversations, and users for the specific subnet or host by selecting the appropriate link (View Applications, View Hosts, View Users, View Conversations, View URLs) within the table below the chart. The applications can be viewed as either throughput over time in a stacked area chart or as data volume in a pie chart. When viewed as throughput, you can show just the top applications or the top applications with an 'Other' group to show the total application data for the specified subnet. All other drill down data types will be shown as pie charts only.
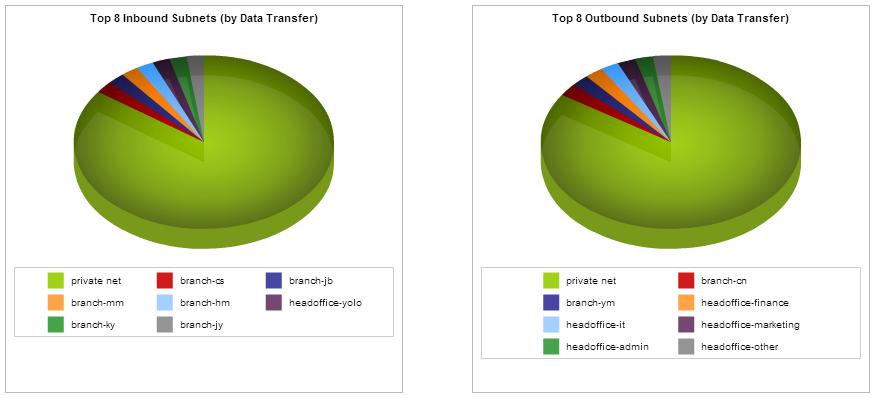
Go to Monitor > Subnets.
Using the Select Subnets to View drop-list at the top of the page, select whether the report displays traffic for internal or external subnets.
The traffic distribution of all subnets is displayed in a chart for either inbound and outbound traffic.
Applications within the subnet - View the applications for the specified subnet by clicking on the View Applications link in the table. The applications can be viewed as throughput over time in a time series chart or as data volume in a pie chart.
Go to System > Setup > Monitoring tab and select either Time series chart (stacked area chart) or Pie graph from the Display for applications details per subnet field.
Check the Show Other checkbox at the top of the page and press the Apply Changes button. The top applications and the other remaining application category will be shown in the chart and in the table below the chart.
Uncheck the Show Other checkbox at the top of the page and press the Apply Changes button. The applications will be shown in the table below the chart. Only the top application will appear in the time series chart.
Note: The number of top applications shown in the time series chart and the number of top applications shown in the table are set independently on the System > Setup > Monitoring page.
Create a network object. See Configure Network Objects .
If Network Object / Subnet statistics collection is disabled, the Subnets report will not include application data for the time period the collection was disabled. See Monitoring Configuration.
If the Subnet Report checkbox is not enabled on the definition of the subnet, then the data will not be included in the report. If the data was collected, then enabling the Subnet Report will immediately show the data in the chart.
The subnet tables below the subnet summary charts can be sorted by data volume or alphabetically by using the System > Setup > Monitoring tab. See Monitoring Configuration.
The number of subnets shown are configurable and can be modified to between 1 - 10 using the System >Setup > Monitoring page. Note: that this configuration applies to all charts on the appliance. See Monitoring Configuration.
To understand how to set the desired time range for a chart, see Setting the Time Range.
To understand how to the charts interact and what the toggle buttons do, see Understanding How Charts Relate.
To understand how to drill into the data to find particular filtered data, see Drilling into the Data.
To understand the difference between inbound and outbound traffic, see Understanding Traffic Direction.
To understand how many data points are shown for each time period, see Understanding Traffic Granularity.
To understand how to print the report or schedule the report, see Printing and Scheduling Reports.
|
|
|